Carbon Calculations
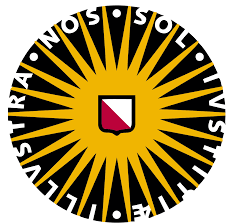
This map is the Google Earth Engine map I created. I started off by using geojson. I found Tahiti on the map and used the "draw polygon (p)" tool to outline the island. I then saved this as a shapefile and imported it onto Google Earth Engine. Based on this, I could find the longitude and latitude. I then used the CEDA archives to find the coordinates that matched. This was quite challenging as the coordinates of Tahiti did not exist so I had to try multiple different coordinates until I found one that overlapped with the location of tahiti. By adding this to the code on Google Earth Engine, I was able to get ACD and create this map.
Tahiti is an island part of French Polynesia in the middle of the Pacific Ocean. It has a tropical climate with tropical rainforests. In this map, I explored which area should be protected based on GPP and ACD. GPP is gross primary productivity which is the rate at which plants are uptaking carbon through photosynthesis. ACD is above-ground carbon density and looks at how much carbon plants store in the parts they have above ground such as branches.
Above-ground Carbon Density
This map looks at carbon dense areas in Tahiti. In this map, we are focusing of ACD. As we can see, most of the island is green but with some black areas. This indicates most of the vegetation on this island stores more than 100 tonnes of carbon per hectare. However, one might wonder why these black areas are there. Although there is no definite answer, it seems these areas are the do not have as many sharp elevation changes and therefore, could be houses. If you would like to see this, you can use the interactive map above follow these steps.
- In the top right corner "mapStlye" is currently selected, click "map"
- A little tab should appear below with the word "terrain", check the box next to it
- Now, click "Layers" and unselect "GPP"
- Play around with the slider next to "ACD" in order to see both the elevation and the colour
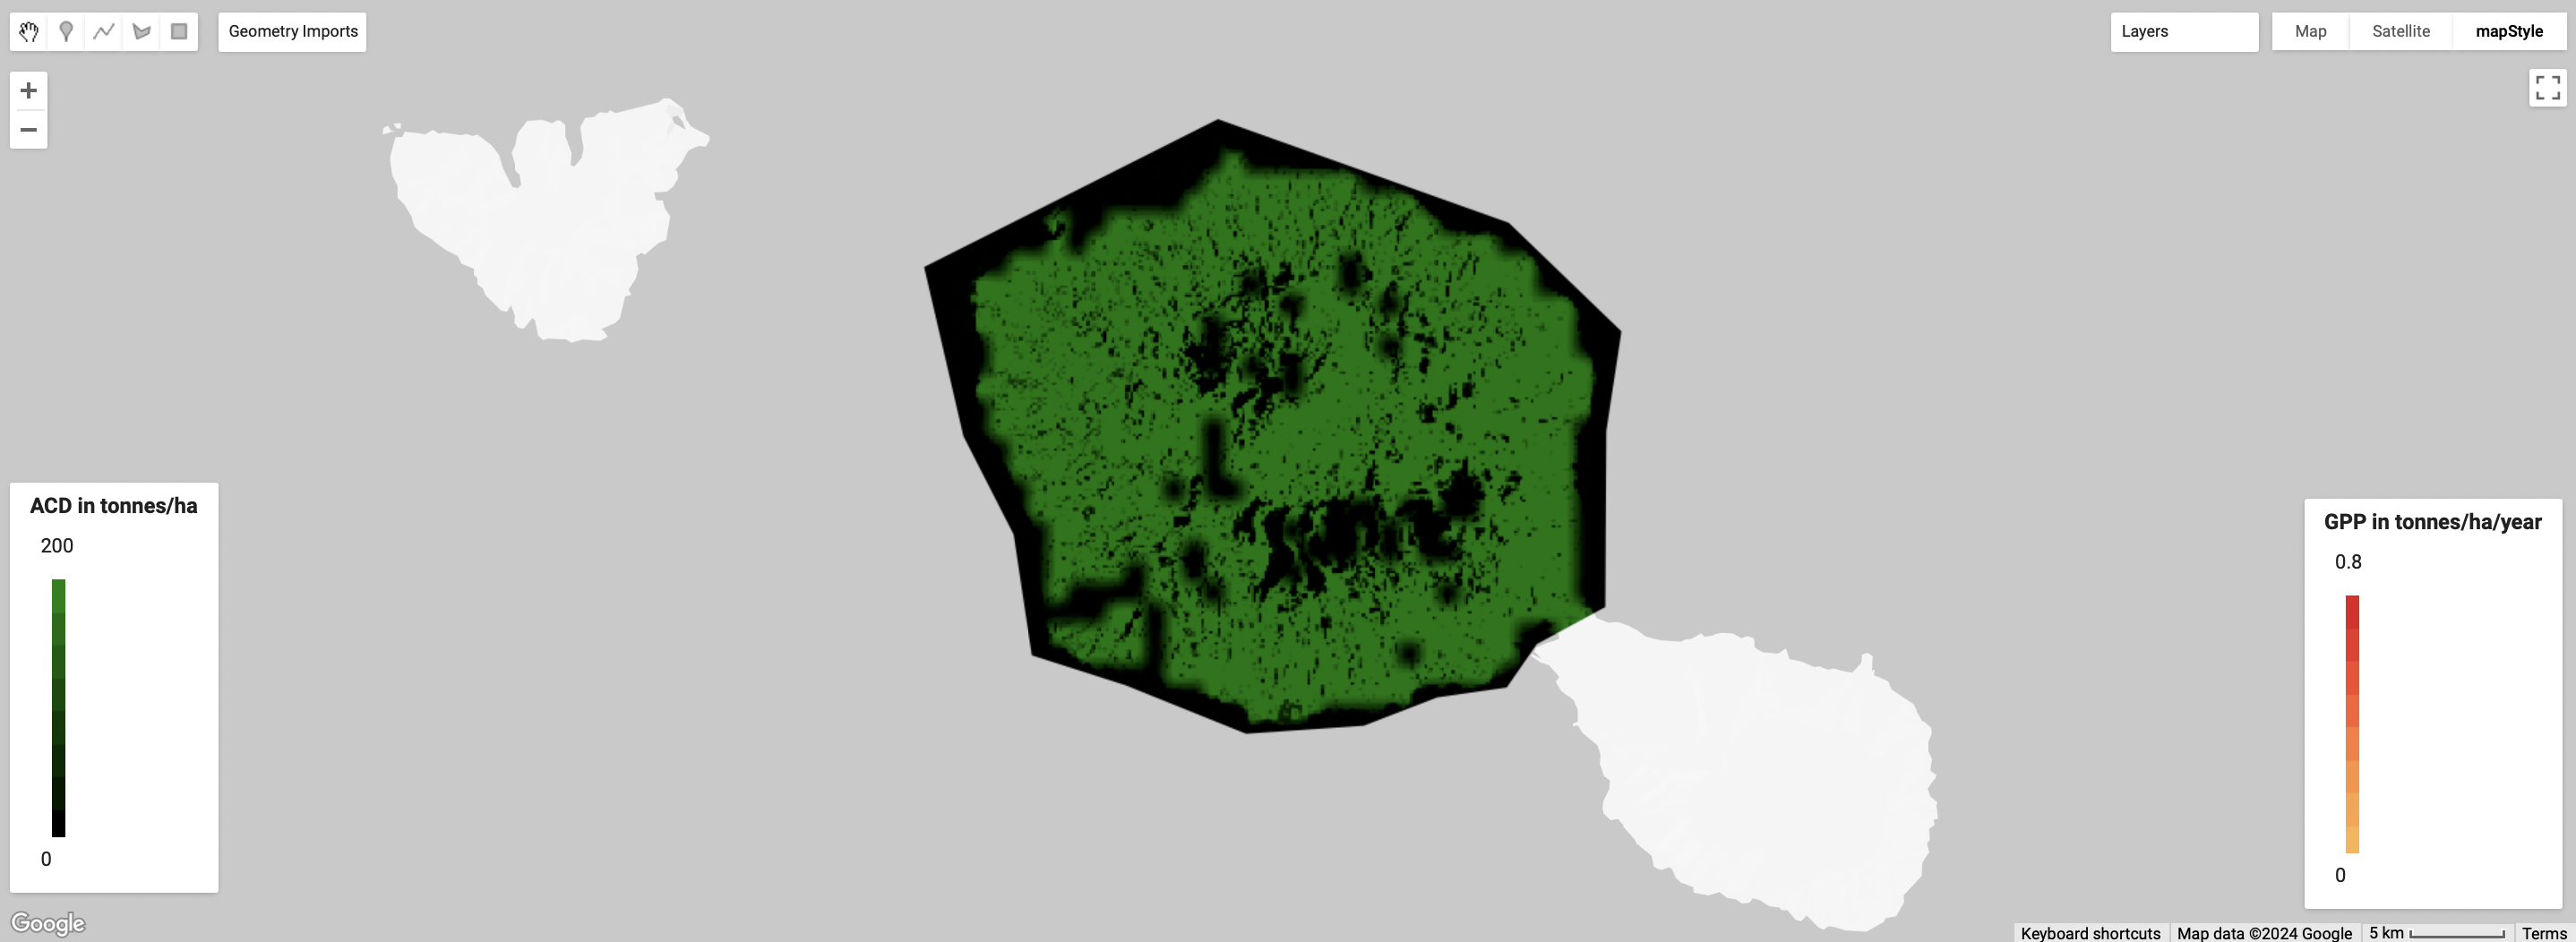
Gross Primary Productivity
In this map, we focus on gross primary productivity. This looks at the total amount of carbon a plant takesup during photosynthesis. The higher the GPP, the more carbon is being taken up therefore, in order to attempt to reduce carbon in the atmosphere, we would want plants that have high GPP.
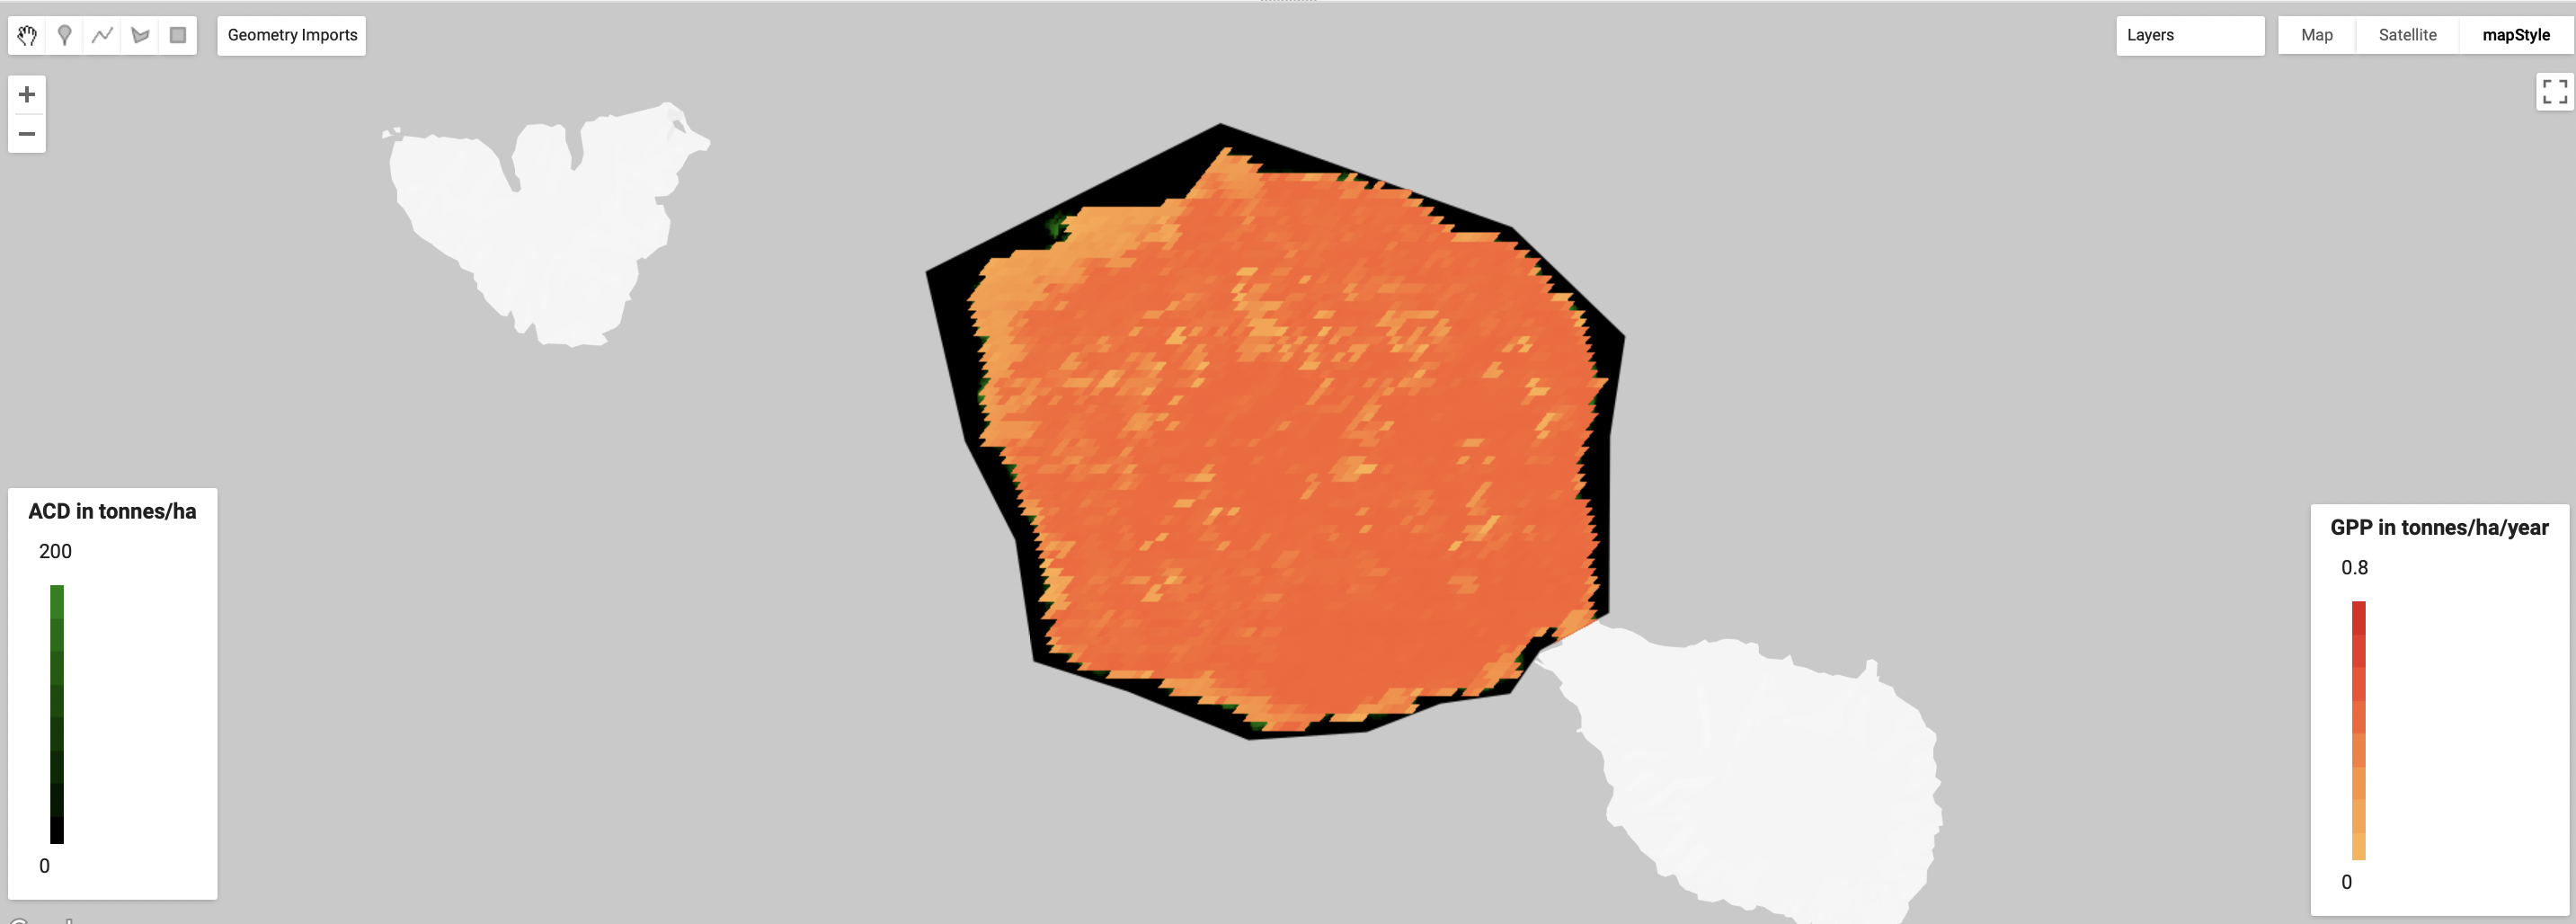
Overlay ACD and GPP
Based on this map which overlayes ACD and GPP, we can see that most areas on Tahiti have high GPP and ACD. When we overlap the two maps and decrease the opacity of GPP, we can see both layers. The very dark areas are low values in ACD. So, a good area to protect would be the centre of island where it is a medium orange colour as it shows both the highest GPP and ACD values. This is also the case after the shore line and before the dark orange colour (low ACD). High ACD areas should be especially protected as they are already have a lot of carbon stored. This island all together would be very important to preserve as GPP is high on a lot of the island. When it comes to ACD, not protecting high ACD areas could lead to a lot of carbon being released while areas with low ACD, still have high GPP which means they have the potential to take up more carbon.